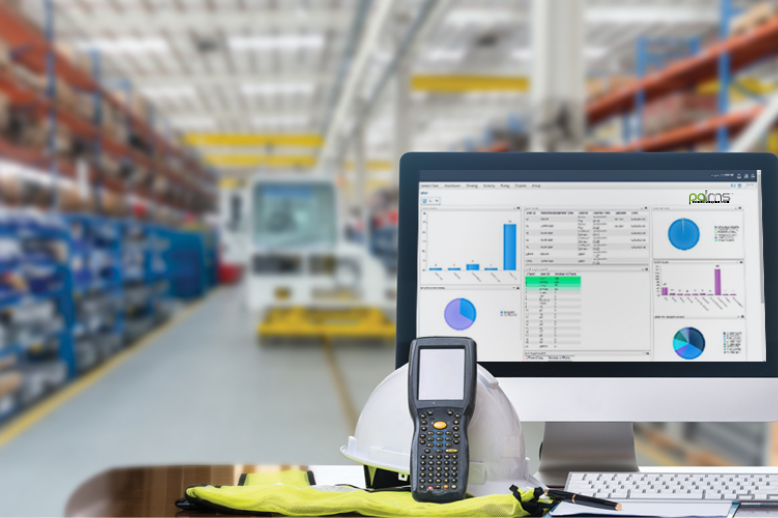
Dashboard Storytelling: Tell stories with Data!
Introduction to Dashboard
Today, we live in a world where there is a problem of data overload. Hence, we, at times, end up processing the wrong set of data which can be really frustrating leading to wrong decision making. Presenting the whole data concisely brings a lot of clarity and efficiency in pulling the right information. Dashboard storytelling is the need of the hour. It is the visual representation of data related to business processes and strategies combined with the art of storytelling. Dashboard, very similar to a story, is designed keeping its audience in mind. It conveys information and inspire audience to take informed decisions. The purpose of dashboard is to represent the performance of the business in a holistic manner to promote better understanding of performance parameters.
Purpose of a Dashboard
- Improves Efficiency – Dashboard summarizes the overall performance of the business which is easy to understand and comprehend, and enables a user to take the right decisions. Hence, it is a time-saving and efficient way of visualizing data. E.g., a logistics manager can gauge the demand and supply of goods in a warehouse with the help of dashboard thereby estimating the demand of vehicles per day efficiently.
- Better Visibility – A dashboard provides snapshot of current condition of a business thereby improving visibility and early signs of any issues in the business. E.g., a Production Manager can use a Sales Dashboard to estimate the monthly demand of a particular SKU and hence, estimate requirement for procurement of an SKU thereby reducing production cost.
- Better decision-making – A dashboard enables user to understand the business performance thereby enabling them to take more informed decision. E.g., a Warehouse Supervisor can track Order Lead Time to take a decision how the Picking should be done in the Warehouse.
Different Dashboard Stories for different Stakeholders
Dashboard Storytelling is not just about presenting everything we have at hand in the form of graphs, charts, etc. A thorough study needs to be done to know what to present and what will be the desired output. An important consideration here should be who will be consuming the data i.e., audience who will be using the dashboard. Different dashboards should be designed for different audience. Top management in a company would like to see overall performance of the company while Office manager is concerned about daily operations. A perfect example of this would be a Warehouse Dashboard.
Dashboard designed for multiple warehouses of a company and analyzed by Country Supply Chain Manager will have following KPIs:
- Customer TAT
- Customer Confidence
- Overall Profitability
On the other hand, dashboard designed for a single warehouse and analyzed by Operations Manager will have following KPIs:
- Receiving Efficiency
- Inventory Turnover
- Rate of Sales Return
- Backorder Rate
- Order Lead Time
Hence, different Stakeholders in a company need different dashboards.
Consistency in data is the need of the hour!
Now the next big question is even if we have identified the stakeholder for whom the dashboard is to be built, how can we build such a system to ensure consistency in the data. One of the ways to ensure consistency in the data is to minimize the manual intervention at the generation side of data as well as at the consumption side of data. For minimizing manual intervention, process should be made more System-Oriented rather than People-Oriented. In a warehouse, this can be achieved by using a Warehouse Management System which will guide users at each step of the operation instead of users taking their own decisions. This will ensure standard procedures being followed in the warehouse. Hence, consistent data will be generated with minimum data leakage.
Happy Ending!
Dashboard Storytelling not only presents performance of the business to the stakeholders but also encourages them to take relevant actions by tracking performance. It also enhances visibility and thus, right decisions can be taken at the right time. For designing an efficient dashboard for a stakeholder, first we need to identify right KPIs (Key Performance Indicators) and track those identified KPIs in a dashboard for different stakeholders. We also need to be sure of integrity of the data presented and this can be done using automated systems reducing human intervention.
